Viewing run details
In the last section, you successfully materialized an asset using the Dagster UI. The UI told you that the run was successful - but what if it hadn’t been? What would that look like, and how would you troubleshoot it? In this section, we’ll show you where to find run information in the Dagster UI and how to use it to pinpoint issues.
Before we jump into troubleshooting failures, let’s take a look at the details of the successful run you just kicked off.
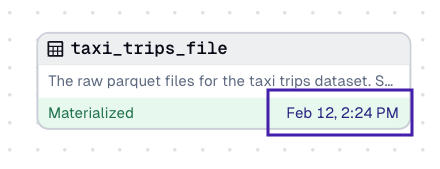
To view the details, locate the Materialized - <DATE> portion of the asset in the graph. Click the date - highlighted in the following image - to open the Run details page:
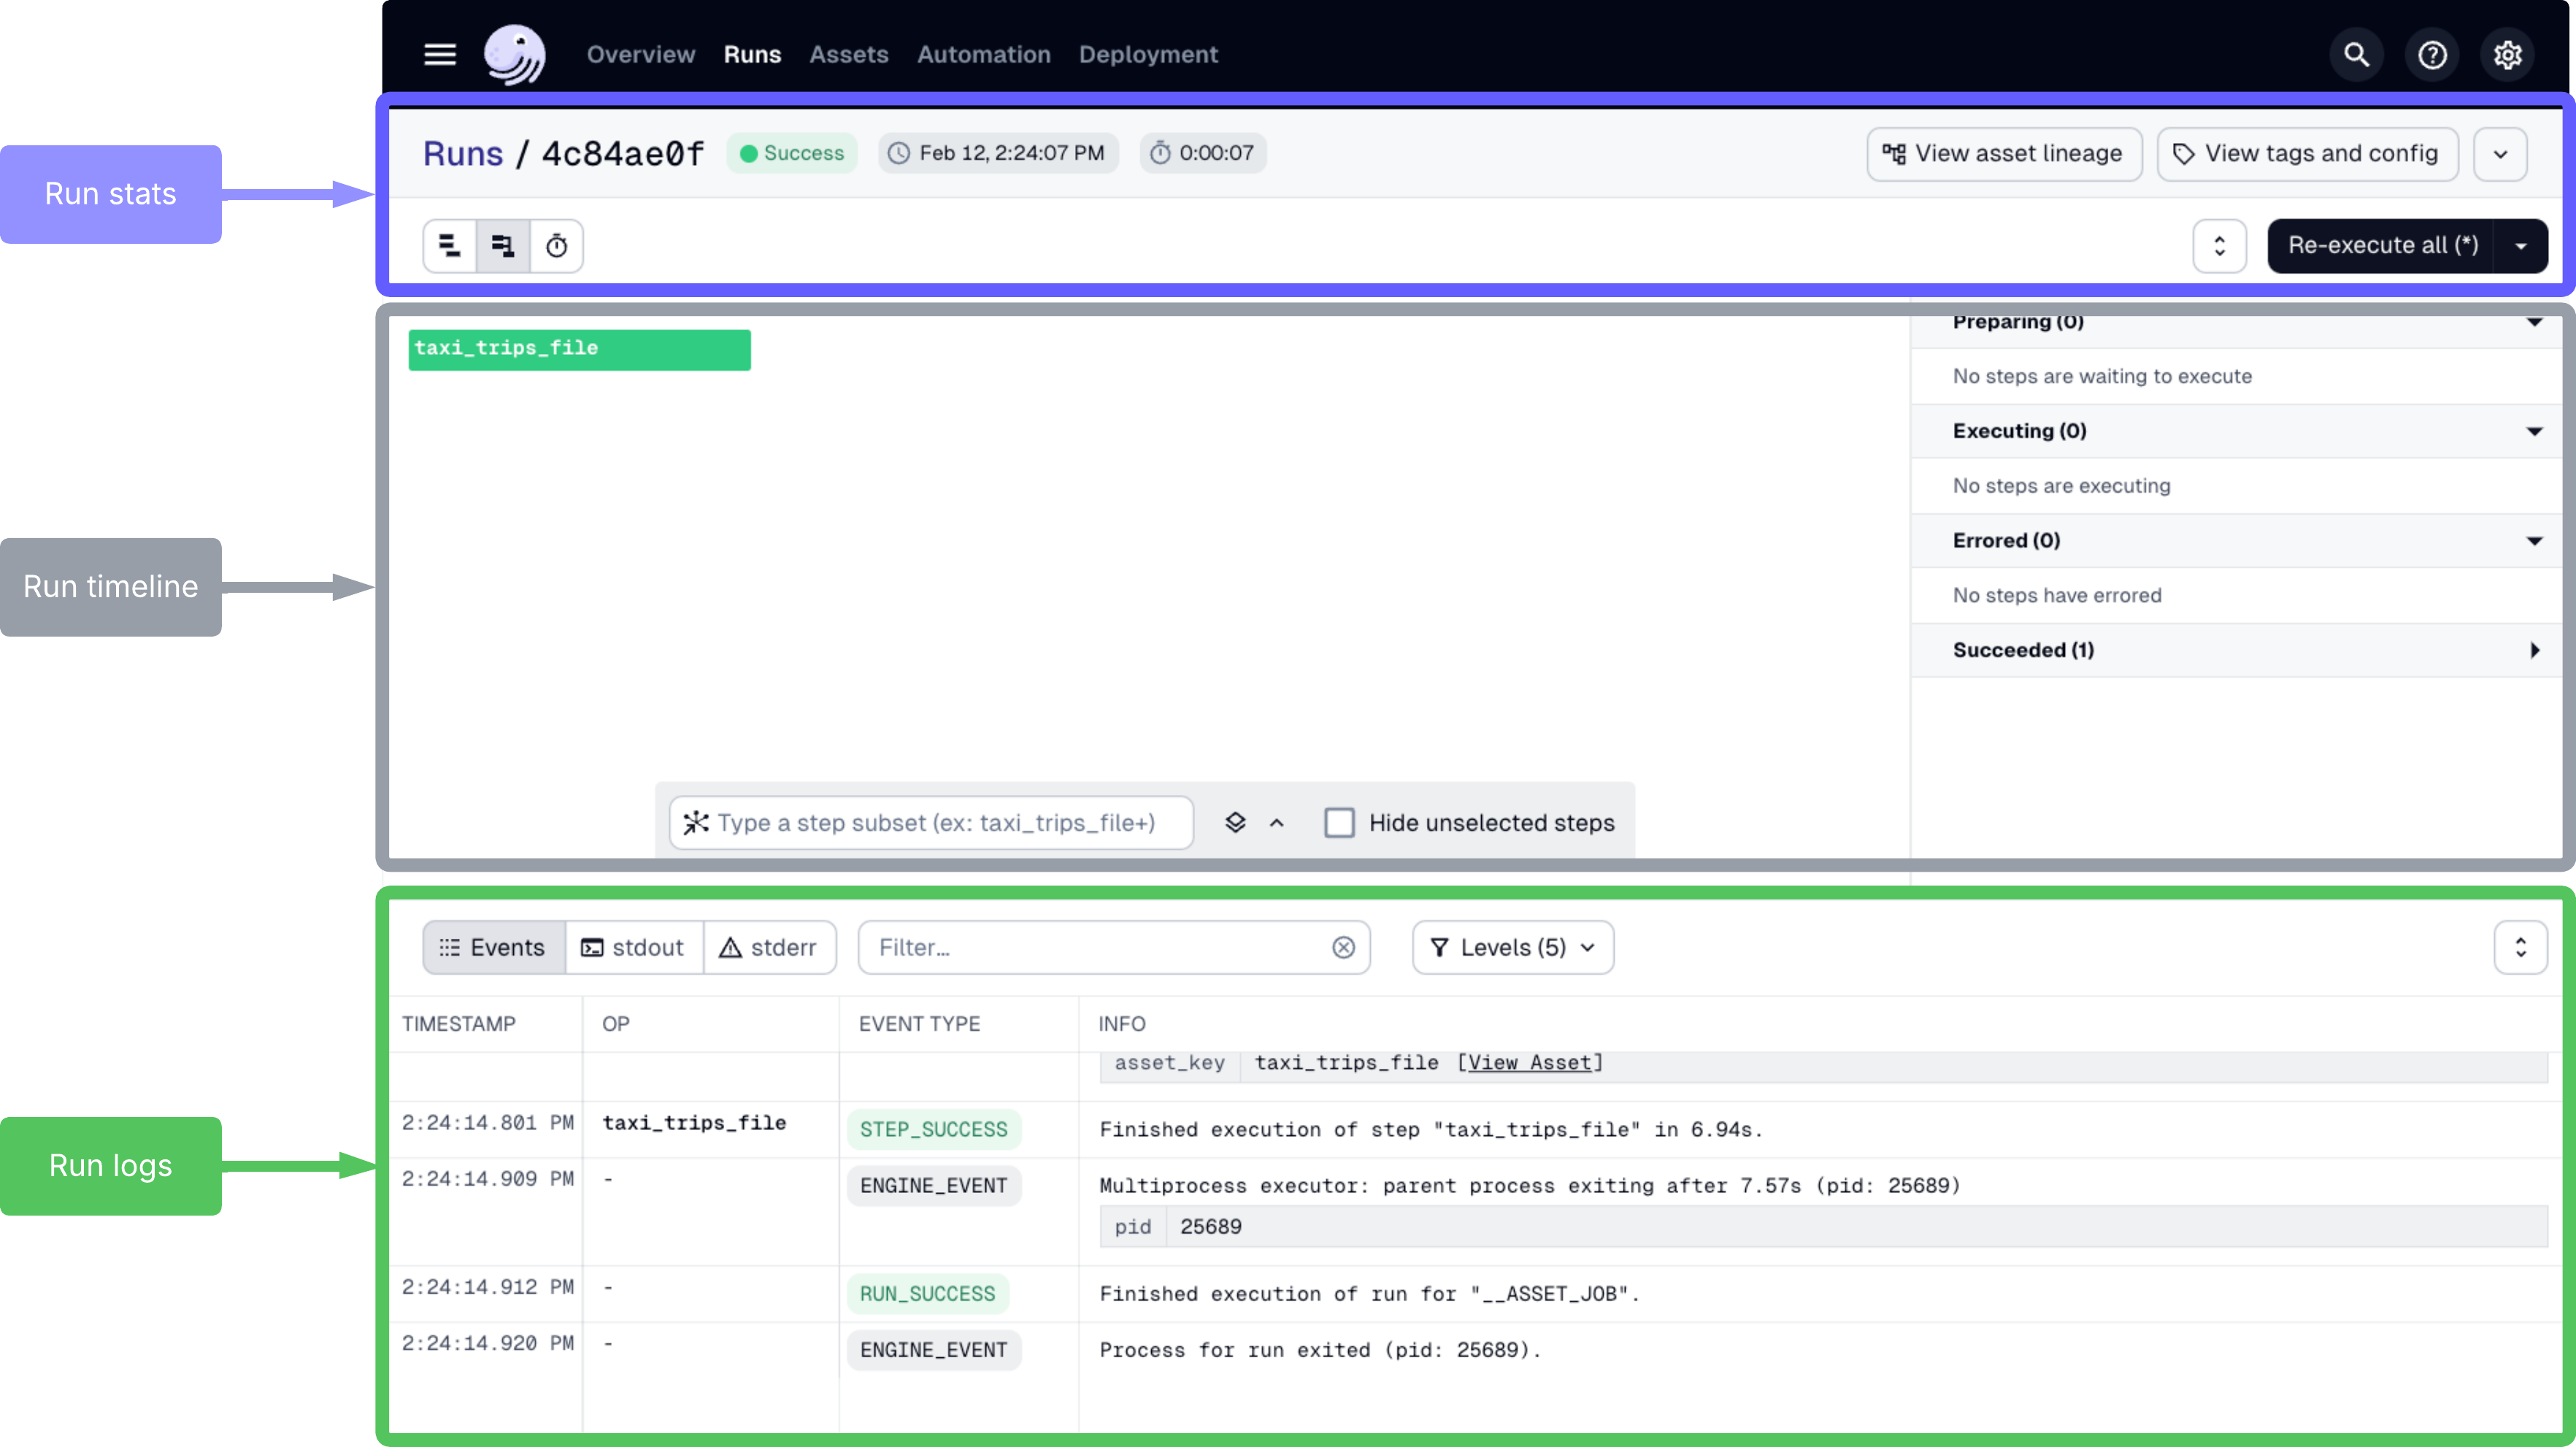
The Run details page contains three main sections:
- The high-level stats about the job, such as its ID, status, date, and duration
- The timeline view, which shows when each step is executed and its duration
- The logs, which contain detailed info about each step and its execution
Let’s take a look at each section:
Run stats
Let’s start with the top portion of the page, which provides high-level stats about the run.
Here, you’ll find the run’s ID, its status, the name of the affected asset, the date it ran, and how long it took to complete. There are also buttons for the Launchpad and tags and config, which we’ll focus on later in the course.
Run timeline
Below the run stats is the Run timeline:
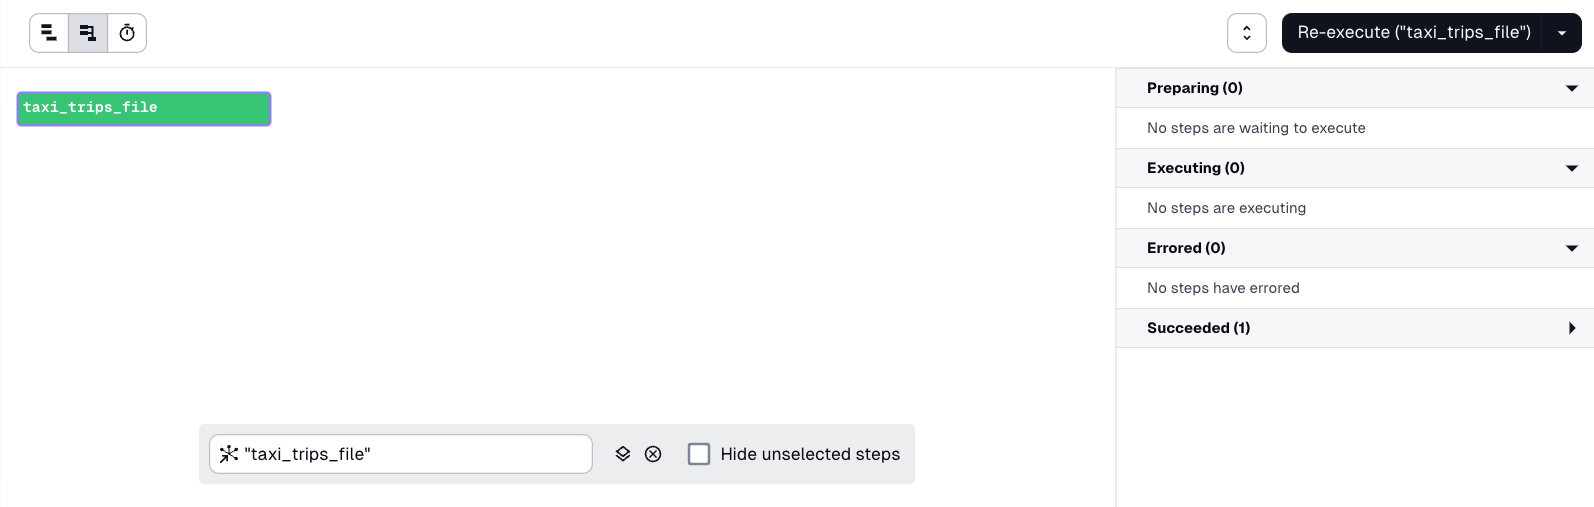
The timeline visualizes how long each step in the run took to complete and whether it finished successfully or encountered an error. In this example, the taxi_trips_file step - the only step in this particular run - is highlighted in green, indicating it finished successfully.
Using the toggles on the left side and above the graph, you can change how this displays depending on your needs.